UnitedHealth CEO shot
I only ask because this New York government website shows that homicide arrests have DOUBLED since 2014 (the data ends at 2023).
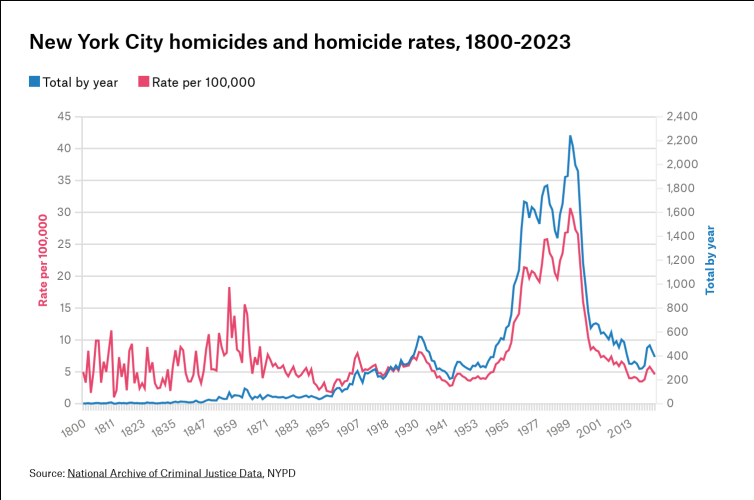
I put in the filters for the five counties comprising NYC (Queens, Bronx, Staten Island, Brooklyn, and Manhattan) and arrests for PL Article 125 Homicides. If arrests have doubled but convictions have stayed the same or decreased (assuming I am correct about your graph), then there needs to be some context to explain that discrepancy.
https://www.criminaljustice.ny.gov/crimnet/ojsa/tableau_Adult_Arrest_County.htm
The issue is that we aren't seeing a complete picture with that graph. Is that only reporting convictions?
I only ask because this New York government website shows that homicide arrests have DOUBLED since 2014 (the data ends at 2023).
I put in the filters for the five counties comprising NYC (Queens, Bronx, Staten Island, Brooklyn, and Manhattan) and arrests for PL Article 125 Homicides. If arrests have doubled but convictions have stayed the same or decreased (assuming I am correct about your graph), then there needs to be some context to explain that discrepancy.
https://www.criminaljustice.ny.gov/crimnet/ojsa/tableau_Adult_Arrest_County.htm
