Calculating/Comparing Draft Values of Denver Options for Payton (1 Viewer)

This is ridiculous! Everyone’s so uptight about this trade. You really don’t know how the QB class will look next year and our ability to acquire one. The Saints haven’t drafted a QB in the first round since like the 80’s or 70’s. It’s really going to be okay!
No it’s ONLY Archie who drafted in the first round! That is crazy! We have to be the team with the fewest first round QB selections.
 
Good thread. I figured on paper in terms of pure draft value going in what we took had the higher value, and even then I was on board with option 2. Mostly because I want a war chest in 2024 to trade up for a QB, but theoretically we can take the more premium asset (the 2023 1st) and still flip it into 2024 picks if we choose to. My concern would be that we are thinking now instead of 2024.
 
Thank you for a post that would be seen on few football websites anywhere.

But I do have a question. When you say that 2024 picks are discounted by half, are you making the assumption that 2024 draft picks have only half the value of a 2023 draft picks--that is, if pick 14 in 2023 has a value of 1,100 points, the value of pick 14 in 2024 is 550 points?

Yes, this is how I would word it: you look at the chart to see what a given pick in this year's draft would be worth. To use your example, pick 14 in round 1 of this year's (2023) draft is worth 1,100 points (according to the chart I linked in the OP). If you were trying to value the 14th pick in round 1 of next year's (2024) draft, then you would look at the chart and divide it in half, making it 550 points.

Of course, that means that the 14th pick in round 1 of next year's (2024) draft is worth 550 points as of today. Next year, it will be worth, ceterus paribus, 1,100 points. It's like the right to get $100 a year from now would be worth something less than $100 today, so you could buy that right from somebody today for a discount. A year from today, that right will be worth $100 (and because of, inter alia, inflation, that may or may not be able to buy you the same carton of eggs and other basket of goods as you expected). Of course, people can differ on what they believe should be the proper discount. Should it be the interest rate offered by the bank on a savings account? Government bonds? Stock returns? Inflation?

Likewise, with the value of future picks in the NFL, what should the discount be? I've seen reports that teams often discount future rounds by subtracting a round for every year. For example, a round 2 pick next year is worth the same as a round 3 pick at the equivalent draft order position this year. This heuristic has been described as discounting the value of next year's picks by around half.

For example, this 2019 article describing a study of draft pick values has the following comment on the discounted value of future picks:

"The result was that teams for the most part appear to simply discount future picks by 1 round compared to current year picks, which is a very steep discount resulting in most picks only being worth around 50% as much simply because they are a year in the future. The other strange part of this method of discounting is that it doesn't result in an even discount percentage, as future 1st round picks are valued below 40%, while later rounds are all around 50%, implying future 1st round picks can be acquired at a huge discount." (emphasis added)
 
It depends on which compensation chart is used.

I agree that there are different charts that reflect different draft pick values. I chose the one that it appeared most point to as the one supposedly used, but you could use another. Once the framework and formulas are set up, it's easy to change which chart is used to see how the results change.

If I were the one crunching the numbers in the front office, I would create my own chart that is tailored to how my scouts view the value of the picks, just like teams create their own boards for draft day.

The negotiations over the trade would involve determining and exploiting the differences between my team's valuations and the other team's valuations in order to maximize the former.
I think you did a good job. I like your use of charting. That was nice
 
I question the discount factor you used. I would much rather have a 2024 first-round pick than a 2023 second-round pick. In fact, if you can find a team that every year for the next 15 years will give me a first-round pick next year for a second-round pick this year, a second-round pick next year for a third-round pick this year, and then a third-round pick next year for a fourth-round pick this year, I will as general manager build you a dynasty. However, I do not doubt that some teams--their head coach and general manager desperate to win now because jobs are on the line--devalue future draft picks.

I preferred the option not selected because of the possibility that next year Denver's first-round pick could be much higher than 29. If you do not discount the 2024 picks, and if you assume that next year the Saints will be drafting 10th and Denver 20th, then the value of the second option (850 points for pick 20 in 2024 and roughly 70 points for a fourth-round pick in 2023 for a total of 924 points) was greater than the value of the option selected (640 points for pick 29 in 2023, and 380 points for pick 52 in 2024 minus 220 points for pick 74 in 2024, for a total of 800 points. (I am using the point chart on the Walter Football website.) Most teams would generally apply a discount because they want to win now though the strength of the teams involved and the overall strength of the current and future drafts have to be considered. If I apply a 25 percent discount, the option selected by the Saints comes out slightly ahead on points. But again, for me, I would have taken option 2 not because of any points calculation, but because of the possibility of obtaining a first-round pick higher than 29. But the difference between the two options in my view is not great, which is the reason Denver was comfortable offering both.

Finally, though I disagree in part with your analysis because of the discount factor you used, I want to thank you for responding in detail to my question and for giving us an exceptional post supported by data and analytical studies. This is saintsreport.com at its best.
 
Last edited:
I question the discount factor....
I agree with you that a 50% discount doesn't feel right for early 1st pound picks. It would seem to lead to a strategy like you've described of stockpiling future 1st round picks through trades of current picks. The article I linked earlier alluded to this point as well.

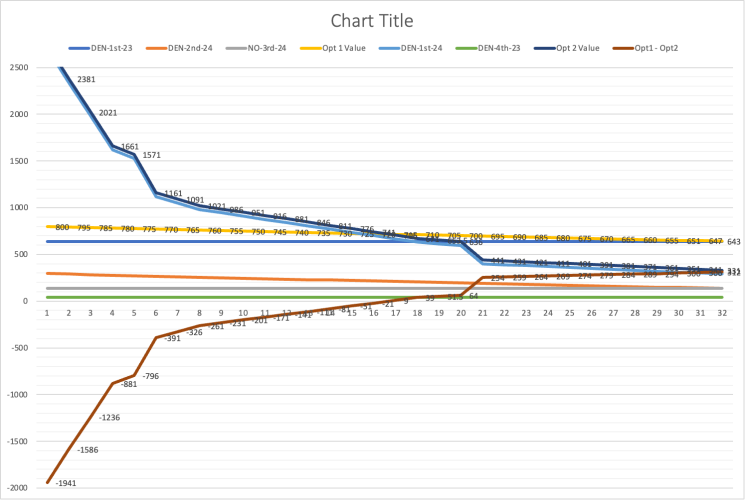
So, I went back and looked at how much the discount factor used on the 2024 picks moves the needle.

Specifically, I changed the discount value from the 50% discount to just a 10% discount for picks in the top 5 of the first round and a 30% discount for picks 6-20 of the first round. I left it at 50% for the rest of the first round and for later rounds.

This changed it to where the draft pick value total for Option 1 was only better than Option 2 when Denver's 2024 pick winds up being a pick at #17 or higher. That is, if Denver does well enough next year to merit a pick at #18 or higher, then Option 1 is better, but Option 2 is better with these new discounts for pick positions #1-16.

Here's the new graph with the lower discounts:
1675375552441.png
A couple of major issues with the above chart or the prior chart is that neither one takes into account:
1) the difference in the magnitude of the outcomes; or
2) the percentage chance that any particular outcome will occur.

For #1, there is a big difference in the result if Denver winds up with the first pick in the 2024 draft than if they wind up with a mid-round pick position, like rolling a pair of dice in which double sixes pays a multiple over more common rolls.

For #2, there is also a big difference in the odds of Denver getting that first pick versus a mid-round pick, such as how the odds of rolling a pair of dice and getting a 7 are higher than getting 6 or 8, which is higher than 5 or 9, etc.

In an attempt to address these issues, I inserted columns to the left with percentage chances of Denver getting each pick position in 2024. I then multiplied those percentages by the outcome values that we had already calculated, resulting in the Expected Values (EV) for each outcome. These columns are to the right. Totaling those results in an overall single figure for each Option, located at the bottom right.

I've included a chart below showing the results using the conventional 50% discount (in which Option 1 is better at 718 v. 549) and a chart showing the results using the discounts described above (in which Options 1 and 2 are about the same at 718 each).

First, the conventional 50% discount chart:
Cumulative % Chance% ChanceDEN-1st-23DEN-2nd-24NO-3rd-24Opt 1 ValueDEN-1st-24DEN-4th-23Opt 2 ValueOpt1 - Opt2Opt 1 Expected ValueOpt 2 Expected Value
0.011%​
0.011%​
1
640​
295​
135​
800​
1500​
41​
1541​
-741​
0.09​
0.17​
0.034%​
0.023%​
2
640​
290​
135​
795​
1300​
41​
1341​
-546​
0.18​
0.31​
0.097%​
0.063%​
3
640​
280​
135​
785​
1100​
41​
1141​
-356​
0.49​
0.72​
0.187%​
0.090%​
4
640​
275​
135​
780​
900​
41​
941​
-161​
0.70​
0.85​
0.466%​
0.279%​
5
640​
270​
135​
775​
850​
41​
891​
-116​
2.16​
2.49​
1.072%​
0.606%​
6
640​
265​
135​
770​
800​
41​
841​
-71​
4.67​
5.10​
1.786%​
0.714%​
7
640​
260​
135​
765​
750​
41​
791​
-26​
5.46​
5.65​
3.593%​
1.807%​
8
640​
255​
135​
760​
700​
41​
741​
19​
13.73​
13.39​
6.681%​
3.088%​
9
640​
250​
135​
755​
675​
41​
716​
39​
23.31​
22.11​
9.680%​
2.999%​
10
640​
245​
135​
750​
650​
41​
691​
59​
22.49​
20.72​
15.866%​
6.186%​
11
640​
240​
135​
745​
625​
41​
666​
79​
46.09​
41.20​
23.000%​
7.134%​
12
640​
235​
135​
740​
600​
41​
641​
99​
52.79​
45.73​
31.500%​
8.500%​
13
640​
230​
135​
735​
575​
41​
616​
119​
62.48​
52.36​
40.500%​
9.000%​
14
640​
225​
135​
730​
550​
41​
591​
139​
65.70​
53.19​
49.000%​
8.500%​
15
640​
220​
135​
725​
525​
41​
566​
159​
61.63​
48.11​
55.000%​
6.000%​
16
640​
215​
135​
720​
500​
41​
541​
179​
43.20​
32.46​
61.000%​
6.000%​
17
640​
210​
135​
715​
475​
41​
516​
199​
42.90​
30.96​
66.667%​
5.667%​
18
640​
205​
135​
710​
450​
41​
491​
219​
40.23​
27.82​
72.000%​
5.333%​
19
640​
200​
135​
705​
437.5​
41​
478.5​
226.5​
37.60​
25.52​
77.000%​
5.000%​
20
640​
195​
135​
700​
425​
41​
466​
234​
35.00​
23.30​
82.000%​
5.000%​
21
640​
190​
135​
695​
400​
41​
441​
254​
34.75​
22.05​
86.433%​
4.433%​
22
640​
185​
135​
690​
390​
41​
431​
259​
30.59​
19.11​
91.924%​
5.491%​
23
640​
180​
135​
685​
380​
41​
421​
264​
37.61​
23.12​
95.543%​
3.619%​
24
640​
175​
135​
680​
370​
41​
411​
269​
24.61​
14.87​
97.725%​
2.182%​
25
640​
170​
135​
675​
360​
41​
401​
274​
14.73​
8.75​
98.928%​
1.203%​
26
640​
165​
135​
670​
350​
41​
391​
279​
8.06​
4.70​
99.379%​
0.451%​
27
640​
160​
135​
665​
340​
41​
381​
284​
3.00​
1.72​
99.653%​
0.274%​
28
640​
155​
135​
660​
330​
41​
371​
289​
1.81​
1.02​
99.903%​
0.250%​
29
640​
150​
135​
655​
320​
41​
361​
294​
1.64​
0.90​
99.966%​
0.063%​
30
640​
146​
135​
651​
310​
41​
351​
300​
0.41​
0.22​
99.989%​
0.023%​
31
640​
142​
135​
647​
300​
41​
341​
306​
0.15​
0.08​
100.000%​
0.011%​
32
640​
138​
135​
643​
290​
41​
331​
312​
0.07​
0.04​
100.000%​
718.33​
548.72​

Note on the percentage chances: I tried to make them a mostly "normal distribution" by looking at a normal distribution / bell curve chart and mapping those to fit a sample of size of 32 events. Also, I looked back at Denver's playoff appearances over the past 15 years and noted that they had made the playoffs in 5 of those 15 years, so I made the last 14 positions have a combined percentage chance of 1/3 of the outcomes.
 
Next, the lower discounts of 10% for picks 1-5, 30% for picks 6-10, and the rest at 50%:
Cumulative % Chance% ChanceDEN-1st-23DEN-2nd-24NO-3rd-24Opt 1 ValueDEN-1st-24DEN-4th-23Opt 2 ValueOpt1 - Opt2Opt 1 Expected ValueOpt 2 Expected Value
0.011%​
0.011%​
1
640​
295​
135​
800​
2700​
41​
2741​
-1941​
0.09​
0.30​
0.034%​
0.023%​
2
640​
290​
135​
795​
2340​
41​
2381​
-1586​
0.18​
0.55​
0.097%​
0.063%​
3
640​
280​
135​
785​
1980​
41​
2021​
-1236​
0.49​
1.27​
0.187%​
0.090%​
4
640​
275​
135​
780​
1620​
41​
1661​
-881​
0.70​
1.49​
0.466%​
0.279%​
5
640​
270​
135​
775​
1530​
41​
1571​
-796​
2.16​
4.38​
1.072%​
0.606%​
6
640​
265​
135​
770​
1120​
41​
1161​
-391​
4.67​
7.04​
1.786%​
0.714%​
7
640​
260​
135​
765​
1050​
41​
1091​
-326​
5.46​
7.79​
3.593%​
1.807%​
8
640​
255​
135​
760​
980​
41​
1021​
-261​
13.73​
18.45​
6.681%​
3.088%​
9
640​
250​
135​
755​
945​
41​
986​
-231​
23.31​
30.45​
9.680%​
2.999%​
10
640​
245​
135​
750​
910​
41​
951​
-201​
22.49​
28.52​
15.866%​
6.186%​
11
640​
240​
135​
745​
875​
41​
916​
-171​
46.09​
56.66​
23.000%​
7.134%​
12
640​
235​
135​
740​
840​
41​
881​
-141​
52.79​
62.85​
31.500%​
8.500%​
13
640​
230​
135​
735​
805​
41​
846​
-111​
62.48​
71.91​
40.500%​
9.000%​
14
640​
225​
135​
730​
770​
41​
811​
-81​
65.70​
72.99​
49.000%​
8.500%​
15
640​
220​
135​
725​
735​
41​
776​
-51​
61.63​
65.96​
55.000%​
6.000%​
16
640​
215​
135​
720​
700​
41​
741​
-21​
43.20​
44.46​
61.000%​
6.000%​
17
640​
210​
135​
715​
665​
41​
706​
9​
42.90​
42.36​
66.667%​
5.667%​
18
640​
205​
135​
710​
630​
41​
671​
39​
40.23​
38.02​
72.000%​
5.333%​
19
640​
200​
135​
705​
612.5​
41​
653.5​
51.5​
37.60​
34.85​
77.000%​
5.000%​
20
640​
195​
135​
700​
595​
41​
636​
64​
35.00​
31.80​
82.000%​
5.000%​
21
640​
190​
135​
695​
400​
41​
441​
254​
34.75​
22.05​
86.433%​
4.433%​
22
640​
185​
135​
690​
390​
41​
431​
259​
30.59​
19.11​
91.924%​
5.491%​
23
640​
180​
135​
685​
380​
41​
421​
264​
37.61​
23.12​
95.543%​
3.619%​
24
640​
175​
135​
680​
370​
41​
411​
269​
24.61​
14.87​
97.725%​
2.182%​
25
640​
170​
135​
675​
360​
41​
401​
274​
14.73​
8.75​
98.928%​
1.203%​
26
640​
165​
135​
670​
350​
41​
391​
279​
8.06​
4.70​
99.379%​
0.451%​
27
640​
160​
135​
665​
340​
41​
381​
284​
3.00​
1.72​
99.653%​
0.274%​
28
640​
155​
135​
660​
330​
41​
371​
289​
1.81​
1.02​
99.903%​
0.250%​
29
640​
150​
135​
655​
320​
41​
361​
294​
1.64​
0.90​
99.966%​
0.063%​
30
640​
146​
135​
651​
310​
41​
351​
300​
0.41​
0.22​
99.989%​
0.023%​
31
640​
142​
135​
647​
300​
41​
341​
306​
0.15​
0.08​
100.000%​
0.011%​
32
640​
138​
135​
643​
290​
41​
331​
312​
0.07​
0.04​
100.000%​
718.33​
718.69​
 
It depends on which compensation chart is used. I’ve seen many with the break even point being about pick 11. It also depends on your build. I honestly would prefer the opportunity of a lottery pick than the certainty of a very late 1st.
Same. In that tough division, if Russ and a handful of other stud Broncos players go down with injuries, then that 2024 1st rd pick could be worth GOLD!!! I mean, even if they do well, we were already looking at a 29th selection. It’s splitting hairs from 29-32
 
TheRamboTX, thank you for your additional analysis. I believe a solid argument could have been made for either option, and I do not fault the Saints for selecting option 1, which provided the team with a late first-round pick in this year's draft. And so much depends on the strength of a particular draft.
 
Last edited:
TheRamboTX, thank you for your additional analysis. I believe a solid argument could have been made for either option, and I do not fault the Saints for selecting option 1, which provided the team with a late first-round pick in this year's draft. And so much depends on the strength of a particular draft.
Agreed.

Thanks for the back and forth discussion (and the kind comments) - it was fun looking into it and discussing it!
 

Create an account or login to comment

You must be a member in order to leave a comment

Create account

Create an account on our community. It's easy!

Log in

Already have an account? Log in here.

Users who are viewing this thread

    Back
    Top Bottom