COVID-19 Outbreak Information Updates (Reboot) [over 150.000,000 US cases (est.), 6,422,520 US hospitilizations, 1,148,691 US deaths.] (9 Viewers)

It's strange how different the responses to this are. This seems a bit extreme for 191 cases but then again, Australia did a good job in shutting it down the first time and steps like this will likely knock it out again. At least in Melbourne.

 
Florida's Pneumonia and Influenza Deaths per year, combined, according to the CDC:

2014: 2,719
2015: 2,676
2016: 2,808
2017: 3,057
2018: 3,091
2019: Not Published


Now, let's analyze 2020.

As of right now, Florida has 213,800 COVID cases, and only 3,841 deaths, which is, in comparison to other states, a massive anomaly. I mean, there is literally a state with only 46k cases and 4,338 deaths (Connecticut).

Now, let's analyze this chart below. See anything odd?

oFq2NFC.png


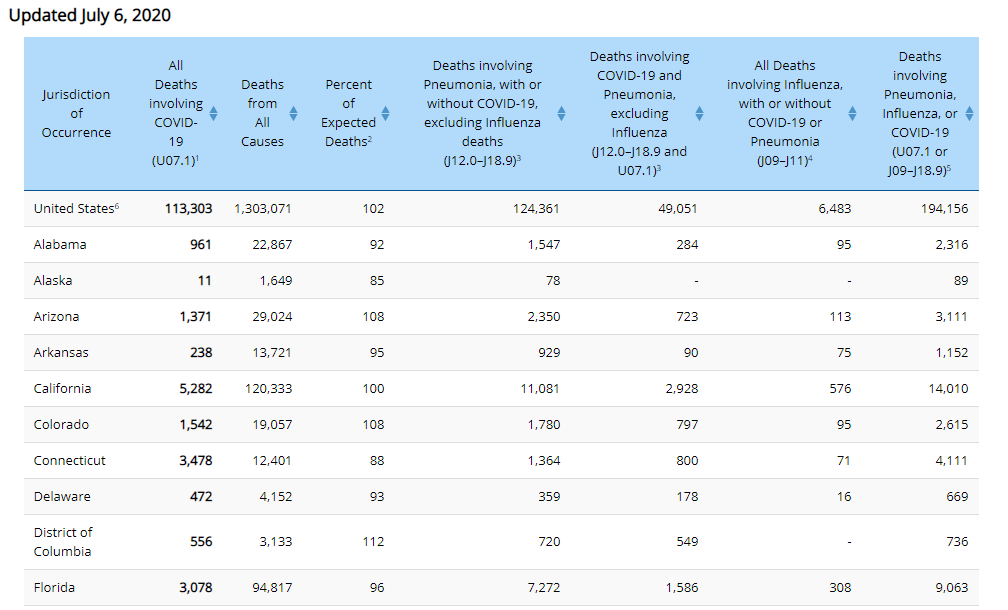
So as of the time this chart was published, there were only 3,078 deaths solely attributed to COVID in Florida, and yet there were 9,063 deaths attributed to Pneumonia, Influenza, or COVID. Meaning, right now, there are 5,985 deaths that are being classified as Pneumonia or Influenza currently. Not only is this about 3,000 more P&I deaths than usual per year for their state, but we also have to factor in that we're only halfway through the year.

The same exercise can be done with other states. Let's look at Texas, who currently has 210,006 cases and only 2,738 deaths.

P&I Deaths per year, in Texas -

2014: 3,452
2015: 3,214
2016: 2,860
2017: 2,954
2018: 3,516
2019: Not Published

2020 Data -

rutShXt.png

Oo1qTHm.png


So 2,257 pure COVID deaths at the time this chart was published, and 8,373 P&I or COVID deaths, which means 6,116 deaths currently attributed to P&I, about 3,000 more per usual per year, and we're only halfway through the year.


Lastly, let's look at the U.S. as a whole (had to drop the CDC chart into Excel using the option at the bottom of the page, and did a quick pivot table):

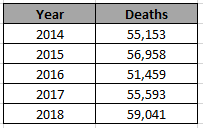
United States P&I Deaths per year -

AUqOM7H.png


Thus far in 2020, as of the time of the previously posted CDC chart's publishing, there were 113,303 deaths attributed solely to COVID, and 194,156 attributed to P&I or COVID, meaning 80,853 deaths are being classified as P&I, a good 20,000+ over our normal steady average, through only half the year.

I made this statement before in the other thread but it bears repeating -

Either there is some serious data manipulation going on, or our country is in the midst of the single deadliest Pneumonia outbreak in its history. Either way, it should be front page news.
 
Yeah, Florida averaging roughly 1000 Pneumonia deaths a year pre covid and reporting nearly 6000 this year does raise an eyebrow.

It doesn't raise an eyebrow. It's intentional misreporting of the extent of a massive pandemic.

If you can't get worthwhile data, you can't decide how to plan to either best limit the pandemic or to open the society and economy.

Honestly, at this point I don't know how you can separate the political part of the pandemic from the thread; hunger and disease are an integral part of life, but famine and pandemic are inevitably man-made.
 
Trying to figure out next steps. Dr won't do an office visit since well exposure and that's totally understandable. Insurance won't cover video visit unless diagnosis is covid. Can't diagnose covid over a video. Waiting on nurse to call back and see how they'd code the visit and if I'd need to cover the negotiated amount for the visit on top of the copay.

#catch22
 
Arizona going off.


That percentage number on positive tests is insane. That spike in deaths is probably the canary in the coal mine for spikes in other states to start following. The next couple of weeks are just going to be terrible.
 
Arizona going off.


That percentage number on positive tests is insane. That spike in deaths is probably the canary in the coal mine for spikes in other states to start following. The next couple of weeks are just going to be terrible.

Arizona - averaging 820 Pneumonia and Influenza deaths per year from 2014-2018, and standing at 1,740 only midway through 2020, according to the CDC data.
 
It's strange how different the responses to this are. This seems a bit extreme for 191 cases but then again, Australia did a good job in shutting it down the first time and steps like this will likely knock it out again. At least in Melbourne.


We've been told that we are expected to teach every day, with fewer students and spacing - so all spaces getting changed up - squash courts, gyms, drama theater rooms, amphitheater, etc. But I really don't think that's going to last very long - the assumption is that we will be in a shut down perhaps even before September ends. It'll only take a couple of weeks.

I'm paranoid already

so, I'll be teaching from inside a Bacta tank.
 
It's strange how different the responses to this are. This seems a bit extreme for 191 cases but then again, Australia did a good job in shutting it down the first time and steps like this will likely knock it out again. At least in Melbourne.


This is the proper way to handle IMO; it's just a matter of what countries/states/provinces have the courage to take it this far.

Getting ahead of it and playing offense is key, rather than doing what most places do - be reactionary and play defense. It's a tough sell on citizens I'm sure, but thus far, virtually every place that chose to wait and play defense, has paid for it dearly.

In a poll taken here a couple of days ago, nearly 70% of Canadians favor a shut down if it looks like we're headed for another wave. Even that number isn't high enough, imo. It takes a ton of will.

But it also takes government leadership to provide financial support to families and businesses and make sure healthcare needs are taken care of. And I imagine it would require cooperation across all levels of government.

Rural areas are going to face different challenges than urban, for example. But the first step is having people willing to buy in, but they need to feel like someone has their back, too.
Really not much different than the US. I think it's 65%-35%. Our 35% are just a lot more volatile.
 
Florida's Pneumonia and Influenza Deaths per year, combined, according to the CDC:

2014: 2,719
2015: 2,676
2016: 2,808
2017: 3,057
2018: 3,091
2019: Not Published


Now, let's analyze 2020.

As of right now, Florida has 213,800 COVID cases, and only 3,841 deaths, which is, in comparison to other states, a massive anomaly. I mean, there is literally a state with only 46k cases and 4,338 deaths (Connecticut).

Now, let's analyze this chart below. See anything odd?

oFq2NFC.png


So as of the time this chart was published, there were only 3,078 deaths solely attributed to COVID in Florida, and yet there were 9,063 deaths attributed to Pneumonia, Influenza, or COVID. Meaning, right now, there are 5,985 deaths that are being classified as Pneumonia or Influenza currently. Not only is this about 3,000 more P&I deaths than usual per year for their state, but we also have to factor in that we're only halfway through the year.

The same exercise can be done with other states. Let's look at Texas, who currently has 210,006 cases and only 2,738 deaths.

P&I Deaths per year, in Texas -

2014: 3,452
2015: 3,214
2016: 2,860
2017: 2,954
2018: 3,516
2019: Not Published

2020 Data -

rutShXt.png

Oo1qTHm.png


So 2,257 pure COVID deaths at the time this chart was published, and 8,373 P&I or COVID deaths, which means 6,116 deaths currently attributed to P&I, about 3,000 more per usual per year, and we're only halfway through the year.


Lastly, let's look at the U.S. as a whole (had to drop the CDC chart into Excel using the option at the bottom of the page, and did a quick pivot table):

United States P&I Deaths per year -

AUqOM7H.png


Thus far in 2020, as of the time of the previously posted CDC chart's publishing, there were 113,303 deaths attributed solely to COVID, and 194,156 attributed to P&I or COVID, meaning 80,853 deaths are being classified as P&I, a good 20,000+ over our normal steady average, through only half the year.

I made this statement before in the other thread but it bears repeating -

Either there is some serious data manipulation going on, or our country is in the midst of the single deadliest Pneumonia outbreak in its history. Either way, it should be front page news.
There may or may not be some supression of data based on those charts, I'd keep mindful of it, but not focus too hard "in the moment".

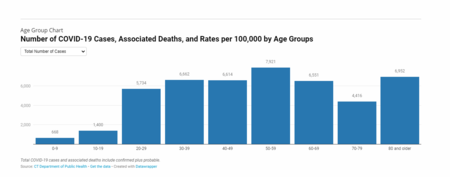
However, CT vs FL. Big difference is median age. Most of our deaths were from the earlier wave, with a much higher median age (I think it was in the 50's at some point).

I don't know CT's median age, but it's much higher than FL's based on the age distribution. I'd say it is centered between 50-69, since that 80 and up cohort is quite large. Remember, that cohort has a 25-50% fatality rate based on what I can recall (could be wrong, but it's high).

CT
1594139280963.png
 
I mentioned Oregon earlier, so I want to follow up on them.

They have averaged 492 P&I deaths per year from 2014-2018. As of the time of the CDC chart in my earlier post, they are at 745 through the midway point of the year, and were reporting only 201 COVID deaths at the time of the chart's publishing. What's equally odd about Oregon is that they have only 10,395 COVID cases despite reaching case #1,000 all the way back in early April. Once again, for anyone paying close attention to things, we know that this is simply not possible for a state with a population of 4.2 million.

So I dug a little deeper, and what I have found is stunning. Despite having mid-range size population, this state has the second fewest tests administered per capita in the nation, trailing only Idaho. They're simply not testing folks, sending people home. And, shocker - they're seeing an uptick in at-home deaths attributed to unknown causes.

This article is from late April (could not find anything more recent) -

In all, 245 more Oregonians died during the five weeks between March 16 and April 19 than during those same five weeks in 2017, 2018 and 2019, on average. During those five weeks, 78 Oregonians died from COVID-19, according to the state health authority’s official count.

It is unclear if other fallout from the pandemic, including a fear of seeking health care, played a role in the other 167 deaths, and officials said the data are preliminary. What is clear: Nearly all the above-average deaths occurred at home, among Oregonians both receiving and not receiving hospice care.


So many games being played across the nation, and it truly is crystal clear. As the numbers get bigger in bigger, the disparities and anomalies start to stick out more and more.
 
There may or may not be some supression of data based on those charts, I'd keep mindful of it, but not focus too hard "in the moment".

However, CT vs FL. Big difference is median age. Most of our deaths were from the earlier wave, with a much higher median age (I think it was in the 50's at some point).

I don't know CT's median age, but it's much higher than FL's based on the age distribution. I'd say it is centered between 50-69, since that 80 and up cohort is quite large. Remember, that cohort has a 25-50% fatality rate based on what I can recall (could be wrong, but it's high).

CT
1594139280963.png

I had that very same thought initially, but I ultimately came to the conclusion that this argument only works if you can back-up the spike in P&I deaths also. I mean, through only half the year, that number has more than doubled versus the average per full year.

EDIT: A quick google search says Connecticut's median age is 40.6, Florida is at 42.2.
 

Create an account or login to comment

You must be a member in order to leave a comment

Create account

Create an account on our community. It's easy!

Log in

Already have an account? Log in here.

Users who are viewing this thread

    Back
    Top Bottom