COVID-19 Outbreak Information Updates (Reboot) [over 150.000,000 US cases (est.), 6,422,520 US hospitilizations, 1,148,691 US deaths.] (11 Viewers)

Buckle up, because we are in for a real sheet show.

Of course, we all knew this was a matter of time, and here we are. I'm not even surprised anymore. Me and my morbid self has been spending more time watching clips of the moment of the massive explosion in Lebanon than anything covid related. Which is pretty sad on my part.

I just don't get people. Hey, when we finish building the Enterprise and ready for space adventures, sign me up!
 
Florida's Pneumonia and Influenza Deaths per year, combined, according to the CDC:

2014: 2,719
2015: 2,676
2016: 2,808
2017: 3,057
2018: 3,091
2019: Not Published


Now, let's analyze 2020.

As of right now, Florida has 213,800 COVID cases, and only 3,841 deaths, which is, in comparison to other states, a massive anomaly. I mean, there is literally a state with only 46k cases and 4,338 deaths (Connecticut).

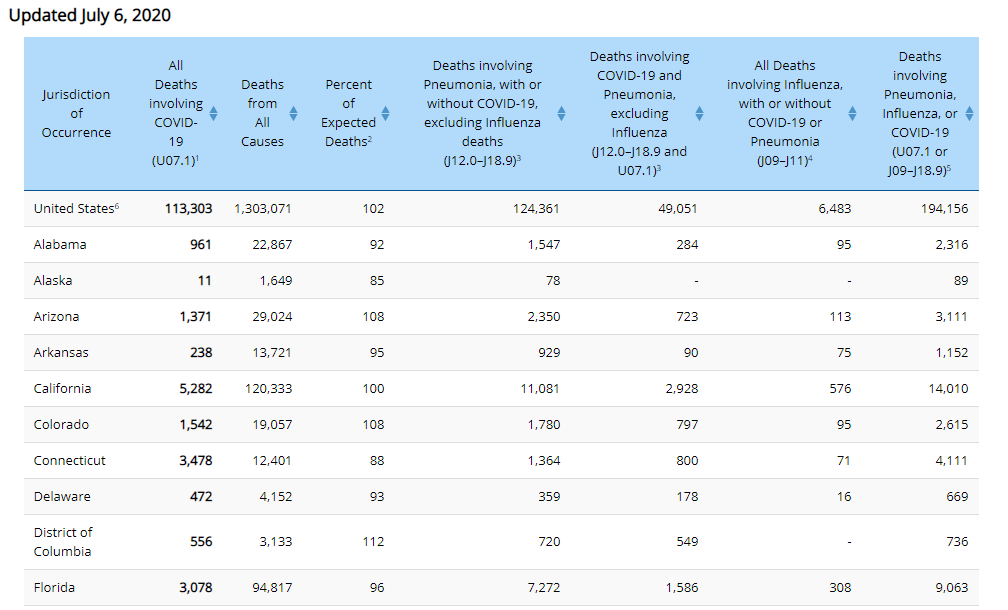
Now, let's analyze this chart below. See anything odd?

oFq2NFC.png


So as of the time this chart was published, there were only 3,078 deaths solely attributed to COVID in Florida, and yet there were 9,063 deaths attributed to Pneumonia, Influenza, or COVID. Meaning, right now, there are 5,985 deaths that are being classified as Pneumonia or Influenza currently. Not only is this about 3,000 more P&I deaths than usual per year for their state, but we also have to factor in that we're only halfway through the year.

The same exercise can be done with other states. Let's look at Texas, who currently has 210,006 cases and only 2,738 deaths.

P&I Deaths per year, in Texas -

2014: 3,452
2015: 3,214
2016: 2,860
2017: 2,954
2018: 3,516
2019: Not Published

2020 Data -

rutShXt.png

Oo1qTHm.png


So 2,257 pure COVID deaths at the time this chart was published, and 8,373 P&I or COVID deaths, which means 6,116 deaths currently attributed to P&I, about 3,000 more per usual per year, and we're only halfway through the year.


Lastly, let's look at the U.S. as a whole (had to drop the CDC chart into Excel using the option at the bottom of the page, and did a quick pivot table):

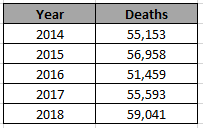
United States P&I Deaths per year -

AUqOM7H.png


Thus far in 2020, as of the time of the previously posted CDC chart's publishing, there were 113,303 deaths attributed solely to COVID, and 194,156 attributed to P&I or COVID, meaning 80,853 deaths are being classified as P&I, a good 20,000+ over our normal steady average, through only half the year.

I made this statement before in the other thread but it bears repeating -

Either there is some serious data manipulation going on, or our country is in the midst of the single deadliest Pneumonia outbreak in its history. Either way, it should be front page news.

I made this post exactly one month ago to today, and at the time it was done, there were 113,303 U.S. deaths involving COVID, and 194,156 involving COVID, Pneumonia, and/or Influenza, meaning 80,853 were being classified as Pneumonia or Influenza officially at that moment in time. Compare that to our last five years of published data (average of 55,641 per year), and we were already more than 25,000 over our normal P&I death average through half the year at the time of that writing.

Fast forward to today, when we do that exact same exercise using the same CDC data as of last week (it’s about a two week lag), and there are currently 144,073 deaths listed involving COVID, and 238,576 deaths involving COVID, Pneumonia, and/or Influenza, meaning 94,503 deaths are being classified as Pneumonia or Influenza currently, through 8 months of the year.

7rcg7DX.png


https://www.cdc.gov/nchs/nvss/vsrr/COVID19/

What this means is that in this past month, our already-absurd P&I number has risen by 13,650, so we now stand an incredible 38,862 P&I deaths above our yearly average in 2020.

But wait, it does not stop there…

Let’s take a look at one other category – “Deaths Not Classified Elsewhere” or, commonly known as “Unknown Causes.”

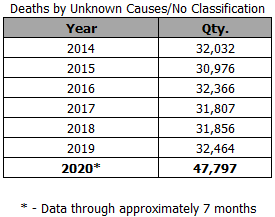
According to our CDC data , from 2014-2019, we have averaged 31,917 such deaths due to unknown causes, with no single year really standing out from the rest. Move on to 2020, and you’ll see that we have 47,797 deaths this year currently rendered as “unknown causes,” meaning we are currently approximately 16,000 deaths above our average in that category, with a whole five months to go still in the year. Essentially, we are on pace to double this category compared to prior years.

XcmGHIM.png


https://data.cdc.gov/NCHS/Weekly-Counts-of-Deaths-by-State-and-Select-Causes/3yf8-kanr/data

https://data.cdc.gov/NCHS/Weekly-Counts-of-Deaths-by-State-and-Select-Causes/muzy-jte6/data

Through six months of 2015-2019, deaths by unknown causes accounted for an average of 48.56 deaths per 1,000,000 population. Through six months of 2020, deaths by unknown causes has accounted for 118.8 deaths per 1,000,000.

m91V7ql.png

OoOktdR.png


tenor.gif
 
Last edited:


This is weird. They're talking about starting their season in September (from the little I could find on it) but are telling players to get jobs in the off-season?

 
I made this post exactly one month ago to today, and at the time it was done, there were 113,303 U.S. deaths involving COVID, and 194,156 involving COVID, Pneumonia, and/or Influenza, meaning 80,853 were being classified as Pneumonia or Influenza officially at that moment in time. Compare that to our last five years of published data (average of 55,641 per year), and we were already more than 25,000 over our normal P&I death average through half the year at the time of that writing.

Fast forward to today, when we do that exact same exercise using the same CDC data as of last week (it’s about a two week lag), and there are currently 144,073 deaths listed involving COVID, and 238,576 deaths involving COVID, Pneumonia, and/or Influenza, meaning 94,503 deaths are being classified as Pneumonia or Influenza currently, through 8 months of the year.

7rcg7DX.png


https://www.cdc.gov/nchs/nvss/vsrr/COVID19/

What this means is that in this past month, our already-absurd P&I number has risen by 13,650, so we now stand an incredible 38,650 P&I deaths above our yearly average in 2020.

But wait, it does not stop there…

Let’s take a look at one other category – “Deaths Not Classified Elsewhere” or, commonly known as “Unknown Causes.”

According to our CDC data , from 2014-2019, we have averaged 31,917 such deaths due to unknown causes, with no single year really standing out from the rest. Move on to 2020, and you’ll see that we have 47,797 deaths this year currently rendered as “unknown causes,” meaning we are currently approximately 16,000 deaths above our average in that category, with a whole five months to go still in the year. Essentially, we are on pace to double this category compared to prior years.

XcmGHIM.png


https://data.cdc.gov/NCHS/Weekly-Counts-of-Deaths-by-State-and-Select-Causes/3yf8-kanr/data

https://data.cdc.gov/NCHS/Weekly-Counts-of-Deaths-by-State-and-Select-Causes/muzy-jte6/data

Through six months of 2015-2019, deaths by unknown causes accounted for an average of 48.56 deaths per 1,000,000 population. Through six months of 2020, deaths by unknown causes has accounted for 118.8 deaths per 1,000,000.

m91V7ql.png

OoOktdR.png


tenor.gif

Great work. It tracks with what I know are laughably under-reported hospitalization numbers.
 

Canadians are getting tired of seeing citizens from the disease-ridden United States illegally cross into their country.

In a dispatch for the New York Times, reporter Karen Schwartz, who has dual American and Canadian citizenship, describes how many Canadians are rushing to report “unwanted” American citizens they see sneaking into the Great White North to the Royal Canadian Mounted Police.


In fact, one of Schwartz’s acquaintances warned her recently that “the Canadians are actually doing damage to vehicles with United States plates on them” — and British Columbian Premier John Horgan recently had to chide his citizens to “be kind” to cars with American license plates after seeing multiple reports of harassment and intimidation against their drivers.


Trevor Long, the general manager at the Rimrock Resort Hotel in Banff, tells Schwartz that he’s had problems recently dealing with one man from Alaska who keeps sneaking into the country and demanding that he be allowed to make an appointment at his spa.

I was wondering if there were lots of people sneaking into Canada since I haven't really heard anything about it. This whole "article" is pretty anecdotal but I'm sure people who are refusing to wear masks aren't going to let Canada shutting down the border stop them from crossing it illegally.

ETA: There's a link to the whole NYT article about this at the end of the link provided.
 

🤦‍♂️

If you're riding without a helmet, socializing at close range without a mask probably isn't a difficult step.
 
Looks like it took us 2 weeks and 3 days to go from 4 mill to 5 mill. It took us 2 weeks and 1 day to go from 3 mill to 4 mill, so things have slowed down just a touch.


I was wondering if there were lots of people sneaking into Canada since I haven't really heard anything about it. This whole "article" is pretty anecdotal but I'm sure people who are refusing to wear masks aren't going to let Canada shutting down the border stop them from crossing it illegally.

ETA: There's a link to the whole NYT article about this at the end of the link provided.

"Canadians are getting tired of seeing citizens from the disease-ridden United States illegally cross into their country." LOLK
 

Create an account or login to comment

You must be a member in order to leave a comment

Create account

Create an account on our community. It's easy!

Log in

Already have an account? Log in here.

Users who are viewing this thread

    Back
    Top Bottom