
MikeDelayo
Guest
Offline

A more colorful analysis of potential New Orleans targets
“A picture is worth a thousand words.”
At some point in history, adults decided it was a good idea to start introducing children to turns of phrase that they may not even be able to spell yet, let alone understand. On paper it doesn’t make much sense, but admittedly, the practice has panned out. I’m less concerned with the specifics than others, some of whom have taken up the comical task of finding exactly how many words a picture is worth, but the meaning behind that classic saying has never been lost on me. A single image not only has the potential to communicate more information, but better and different information as well.
In the spirit of the classic adage, I’ve decided to dive into some visuals that underscore some of the free agent big men that could find themselves on the Pelicans in a few days (or weeks). Shot charts of six free agents can be found below for comparisons to four current and soon-to-be-official Pelicans (Lonzo Ball, Brandon Ingram, Jrue Holiday and Zion Williamson) who project to fill out the starting lineup in the 2019-20 season. Yes, I recognize there is much more to a player than where they take their shots, but those images are still insightful and, I would argue, interesting to look at. Take a break from those boring old salary cap numbers, room exceptions and trade kickers to look at these colorful blobs!

Heat charts of the field goal attempts of Lonzo Ball, Brandon Ingram, Jrue Holiday and Zion Williamson from their 2018-19 seasons
The Prospective Pelicans Starters
The charts for Ball, Ingram and Holiday were retrieved from the NBA site, while Williamson’s was created by ESPN’s Kirk Goldsberry. The latter is a hex chart, with larger shapes representing higher frequency and warmer colors indicating higher efficiency. In Williamson’s case, an outsized majority of his shots came right at or within the restricted area with a few scattered around the perimeter. The prior three feature identically-sized points to mark each shot location, with a higher density of shots in an area marked by increased amounts of color. These three charts do not indicate the success rate of shots in this area, so referrals to those figures were sourced by other data from NBA.com and Basketball Reference.
For example, the fireball-like figure in the top-center of Ingram’s chart (top right) means that he took more shots at and around the rim than from any other spot on the floor. The progression from purple to red to white in that tight circle indicates that the attempts were more frequent the closer he got to the basket. Ingram’s profile, which we detailed further earlier this week, helpfully demonstrates the inverse as well, with the purple shifting to dark gray and then ultimately the background-equivalent light gray as he moves towards the three point line.
Ingram still took a fair amount of outside shots, mostly from the elbows. These also point towards a pair of his favorite spots further out on the perimeter which join the right and, to a lesser extent, the left corner as his primary three-point launching pads. Ardent Moreyball acolytes likely got the Dr. Frankenstein treatment from Ingram last season given that 34.5 percent of his total attempts were taken between ten feet from the hoop and three point range, but his willingness to at least dabble along the arc helps create some space in what could still amount to be a crowded half-court.
Holiday’s chart is the most symmetrical of the group, which Michael Scott would agree makes it the best by default without regard for its actual basketball efficiency. Fortunately, the balance on display is encouraging for both Holiday individually and the Pelicans as a whole. Shots of his went up within three feet of the basket a career-high 31.8 percent of the time, and his 31.3 percent three-point rate missed out on being his best by two tenths of a percent. The highest concentration of long-ranged shots came right in the center of the arc, with progressively fewer shots being taken as he approached the corners. A smattering of mid-ranged shots are sandwiched between the arc and the entire paint, which has a brightness indicative of yet another near-career high in shots taken between three and ten feet from the hoop (19.2 percent).
Ball’s chart is the most conducive to success in the modern NBA of the bunch. Exactly 50 percent of his shots were from three point land, most of which came from the same elbow-aligned spots as Ingram, albeit with much more volume. It’s good in theory that he frequented the corners more often than Jrue, but he’s had a surprising amount of trouble knocking down those shots, the most efficient in basketball. Fourteen percent (73) of his 523 career three pointers were taken from the corners and he has only knocked down 17 of them, or 23.3 percent. Like both Ingram and Holiday though, his tendency to get right to the rim distinguishes itself quite easily.
Plenty of time remains before the season to dive deeper into the players above, so let’s get to some of the free agent bigs that may join them in the next few weeks. Here are the top five players as ranked by The Bird Writes team plus one more that I added because this is my post, and I have all of the power.
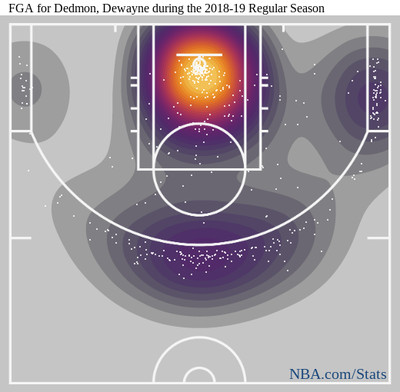
Dewayne Dedmon’s shot chart from the 2018-19 regular season
Dewayne Dedmon
It’s hard to contest Brook Lopez’ status as the poster child for centers rapidly developing perimeter shots, but Dewayne Dedmon gives him a real run for his money. In 224 games between the 2013-14 and 2016-17 seasons, he attempted one three and, unfortunately, did not connect. Then, he hit 50 of 141 attempts (35.5 percent) in 2017-18 and 83 of 217 (38.2 percent) in 2018-19 and voilà, he’s now a legitimate three-point threat.
Last season, 30 percent of those long range attempts came from the corners (mostly in the right one), while most of the rest were taken right at the top of the key. Holiday is the only other projected starter with much volume there, and he and Dedmon could give defenses fits from that spot. Should he slip the screen, Dedmon is too willing and effective a shooter to be left unattended, but allowing Holiday to work with either a mismatch against a big or a paint lacking one is also tough to swallow. Creating conundrums as such for opposing defense is always good, and the Pelicans could theoretically integrate this one without having to sacrifice much.
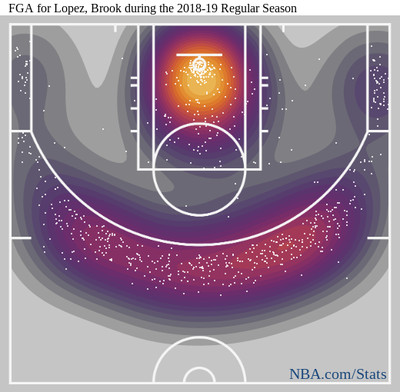
Brook Lopez’ shot chart from the 2018-19 regular season
Brook Lopez
Some of what was said about Dedmon is also true for Lopez, but the latter was much more prolific with his attempts. Lopez led all centers in three-point shots taken by far; his 512 shots outpaced the next highest mark (Karl Anthony-Towns’ 355) by 44.2 percent. This allowed him to display a willingness to shoot from pretty much everywhere above the break, with only the slightest bit of extra concentration towards the right side.
However, just 14.3 percent of his long-ranged attempts came from the corners, and though that is not an inherent problem, it does result in a bit more overlap than may be ideal. Ball and Holiday surely won’t be standing idly by if Lopez is around, but getting the big man consistent space to operate would likely require at least one of them to move towards areas of the floor where they would be less comfortable launching, namely the corners.
As previously stated, Ball has struggled mightily to connect consistently from that part of the floor. Holiday has the opposite problem; he made 41 percent of such attempts, but that is out of a meager 38 total shots, which equates to roughly a tenth of his 363 total threes taken.
A three-point oriented shooter like Lopez helps offset Ingram’s inefficiencies and further open’s up the paint for the young forward’s frequent drives to the basket. Ingram’s ball-handling could also allow for some creativity in a two-man game that even Reed Richards may have trouble defending. How Williamson’s profile takes shape will be worth monitoring, but even if he winds up feasting primarily in the paint this season as expected, Lopez would provide unparalleled spacing.
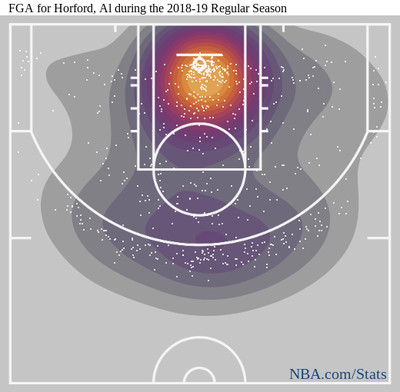
Al Horford’s shot chart from the 2018-19 regular season
Al Horford
The outline of Horford’s chart is a ringer for the Pokémon Ditto, and there could be no better match. Ditto’s trademark is their ability to transform based on their opponents, and Horford’s versatility allows him to do the same against opposing defenses in less disturbing fashion.
Looking for some assertiveness down low? Nothing a 24.2 percent shot rate from within three feet of the hoop can’t handle. Left open from deep? No problem: 28.1 percent of his shots were of the three-point variety. Catch a kick-out pass along the baseline? Another 10 percent of his shots went up from there, too. Save for the grossly inefficient space immediately inside the breaks of the arc that are better off vacant, no part of the floor managed to effectively hide from Horford throughout the season.
Like his fellow prospective Pelicans above, a few more corner threes would have been nice (only 19 of his 203 three-point shots, or 9.4 percent, were launched from either). With that said, the rest of the chart in addition to Horford’s 21.2 percent assist rate and relatively low 13.2 field goal attempts per 36 minutes would make him a fit on nearly any court, including the one inside the Smoothie King Center.
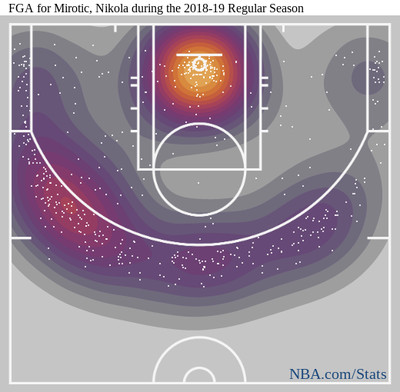
Nikola Mirotic’s shot chart from the 2018-19 regular season
Nikola Mirotic
Before Mirotic’s untimely departure from New Orleans last season, he was shooting a lot of threes: exactly nine per 36 minutes as a matter of fact. In 14 regular season games for the Milwaukee Bucks, he somehow kicked it up a notch, getting 9.8 shots per 36 minutes off from deep, which would have ranked sixth in the league across the entire season. Mirotic’s chart shows what Pelicans fan already know: he’s unafraid to shoot no matter where he is on the court.
He favored the left half of the arc last season, which feels right given that one of his most memorable threes came from right in that hot spot above the break (I’ll never pass up the opportunity to hunt down that clip.) He even stepped into two-point range in that area fairly frequently, but he ventured to his right often enough to maintain a decent balance and keep defenses honest.
It may be a bit hard to notice, but color right at the basket is not as bright for Mirotic as it is for the rest of this list. Horford and (spoiler alert) Maxi Kleber, who took 24.2 and 24.1 percent of their respective shots from within three feet, are closest to Mirotic’s 19.4 percent, but that number representing less than a fifth of his total shots invites a healthy bit of risk.
The potential pitfalls of this profile unfortunately reared their ugly head in the playoffs this year when Mirotic connected on 28.9 percent of his three pointers, which dragged his overall field goal percentage to 37.6 percent. However, the peaks delivered by his ability to catch fire like he did against Portland while donning a Pelicans jersey are clear. His services should be coveted by many teams this weekend and beyond, and it will be interesting to see if New Orleans opts to get in the mix and try for a reunion, sponsored by Gillette of course.
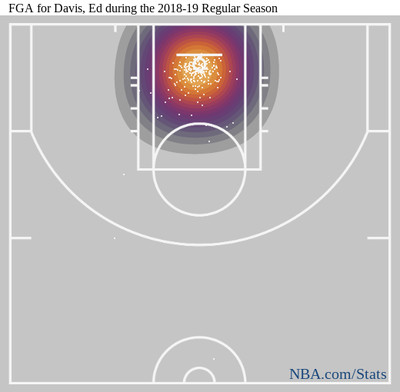
Ed Davis’ shot chart from the 2018-19 regular season
Ed Davis
Here is one of Davis’ three-point shots from last season:
Here is another one, his ONLY other one:
Whether the credit goes to that impressive body of work or his less than four field goal attempts per game (3.7), it’s impossible to confuse Davis for a shooter. It makes him an awkward piece to fit in when focused on shot charts, but out of fairness to him and our rankings, it is worth noting the very particular set of skills he brings to the table that still earn him meaningful minutes in the modern NBA. He is willing to defer to his teammates and capable of setting them up for success with solid screens. He can finish around the rim when needed (68.9 percent within three feet), and his offensive rebound rate (13.5 percent) was sixth-best in basketball among players with more than 15 minutes per game.
The decision for him to join another young team in the Pelicans after just spending time with the ascendant Brooklyn may not be one he wants to make, but keeping a Davis on the roster could be fun for New Orleans. From their 2010-11 season through 2013-14, the NHL’s New York Rangers rostered Brian Boyle, who wore number 22. Boyle, a forward, signed with the Tampa Bay Lightning in the following offseason. The Rangers shifted gears and signed a veteran defenseman: Dan Boyle. Naturally, he wore number 22. Anthony Davis’ career in New Orleans outlasted and outpaced Boyle’s in New York (don’t tell my family that I said this) so the circumstances might be different, but the chaos that giving Ed Davis number 23 (even though Anthony will supposedly keep it in Los Angeles) would cause makes it a fun thought experiment at the very least.
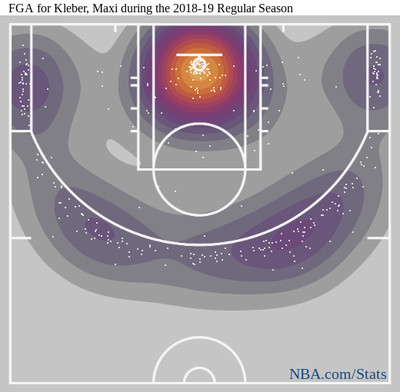
Maxi Kleber’s shot chart from the 2018-19 regular season
Maxi Kleber
Kleber was not included in our rankings, but I found his chart intriguing enough to mention it here. Kleber is the least heralded of any player I have mentioned thus far and that is fair, given that the 27-year-old German is coming off of just his second season in the NBA. However, his production deserves at least a bit of recognition.
He most recently played 21.2 minutes per game for the Dallas Mavericks to the tune of a 57.9 true shooting percentage and 3.1 three point attempts per game. Crucially, more than a third (31.7 percent) of those threes come from the corners, and both corners at that, which is something that Dedmon, who favored the right corner much more than the left, cannot match. There are bright spots above the break that mirror those of Holiday, but the distribution along the arc is clear.
Kleber’s flexibility would allow Alvin Gentry to draw up plays that send him anywhere along the arc without making him less dangerous. His usage rate was only 13.5 percent last year with Dallas, but on a Pelicans roster that will likely want to put the ball in the hands of its young core players, that could provide Kleber just enough chances to make an impact. Given how unproven he is and the fact that he is a restricted free agent, teams will probably consider him a lower-tier option compared to some of the other names on the market. Wherever he may fall on the list of David Griffin and company, I think he’s worth a look.
The Pelicans are fortunate to have both a lot of cap space and a ton of talent in the front office. Maybe they spend big on someone on Horford or Lopez, or divvy up the space to a couple of role players, but they could leave their options open for the future too. Adults have been telling me “Rome wasn’t built in a day,” for my entire life. I may not have known where (or what) Rome was as a grade schooler, but I did come to understand that good things often took time. Hopefully Griffin and Trajan Langdon are on their way to becoming the Romulus and Remus of New Orleans (minus the traitorous murder!)
Continue reading...