bclemms
More than 15K posts served!
Offline
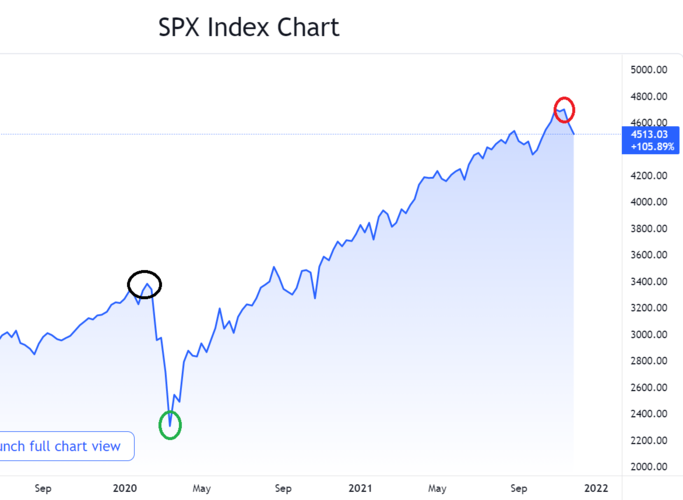
Here is chart that shows covid crash (black), where the FED stepped in with by far the biggest money bomb in history (green). Red is where they announced they would begin tightening.

Historically, it's been a big trigger point for markets to sell off. Historically, some of the longest bull markets in history start after that fall but it tends to be a lot more gradual than what we have seen the last 18 months.

Historically, it's been a big trigger point for markets to sell off. Historically, some of the longest bull markets in history start after that fall but it tends to be a lot more gradual than what we have seen the last 18 months.


